Welcome to the complete, free dashboards course for Google Sheets!
This is the only place that you will find a dashboards course worthy of buying, that is completely free. I want this course to help lots of people, so I am letting my readers / YouTube viewers take it for free!
About me
My name is Corey, I have been building dashboards professionally for over 7 years, and I will be the instructor in your dashboards course. If you want, you can read more about me and the advantages of taking this course, but here on this page is where you will actually start learning these incredibly valuable dashboard building skills.
A note on date formats in varying countries
If you are located in Europe or outside of the U.S., your date format will be different than the United States, and this may affect the creation of some of the dashboards. You can change the date format by clicking File > Settings > General > Locale > United States
The dashboards that you will build in the course
Click the links below to start building each dashboard.
Beginner tutorial:
If you want to learn basic Google Sheets skills before taking this course, try the beginner tutorial first.
Overview:
Click here to see an overview of how to build a dashboard in 3 major steps, as well as to see an overview of building the basic sales dashboard.
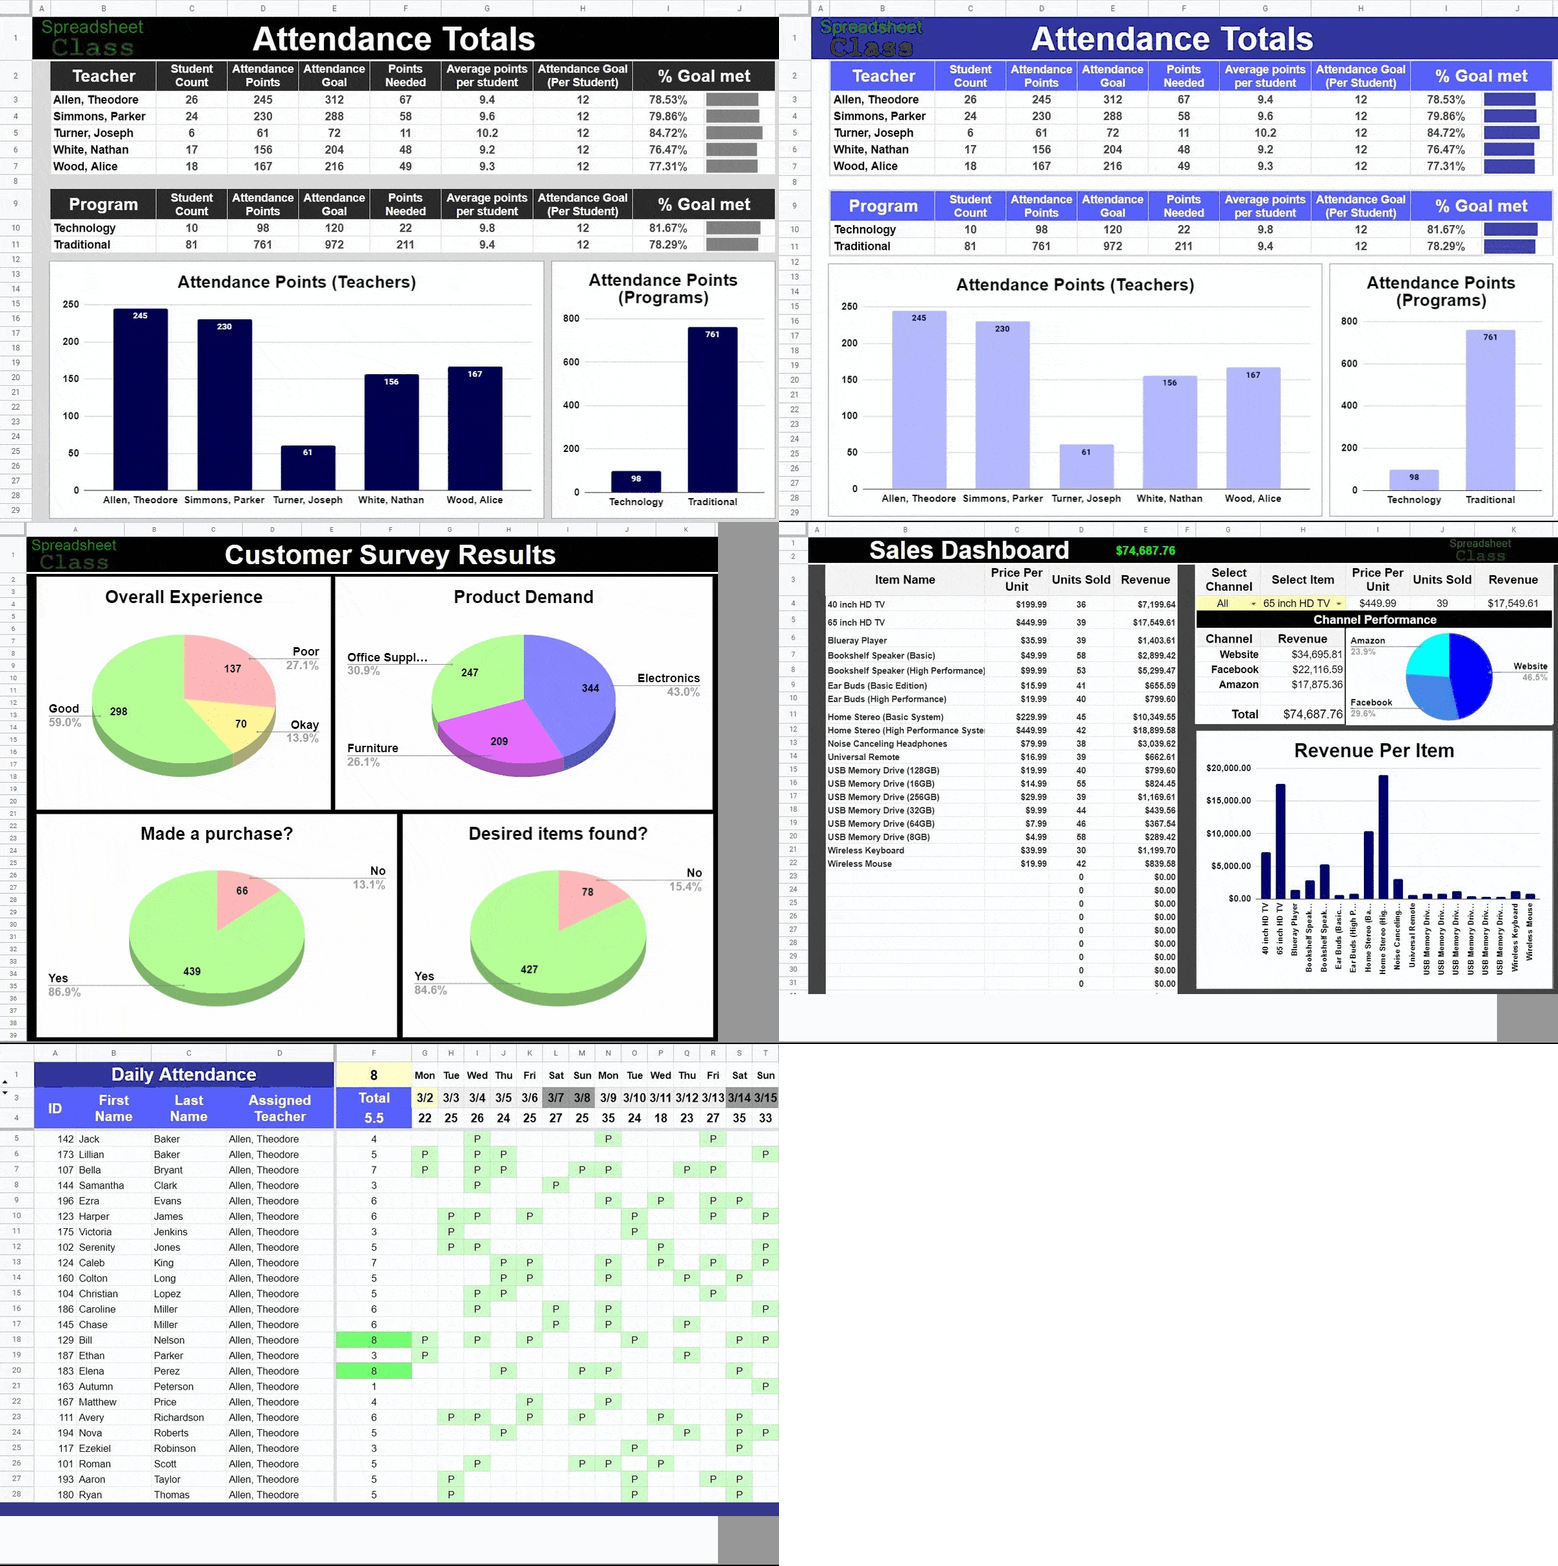
1) Fast & Simple Dashboard (Basic Sales Dashboard Simplified)
2) Full Version: Basic Sales Dashboard (+ Dashboard creation concepts / methods)
Subscribers only courses:
3) Customer Survey Dashboard (Google Forms Dashboard)
4) Online Sales Dashboard (Interactive dashboard)
5) Student Attendance Dashboard / Tracker (Simple + Advanced)
Get the ultimate Google Sheets cheat sheet

See further below for a description of each dashboard, as well as notes on what types of things you will learn with each dashboard.
Important Notes
Remember that each dashboard tutorial will teach you unique concepts not found in the other tutorials, so take your time but complete each dashboard if you want to have rounded knowledge that will help you greatly in the professional world.
With each dashboard you will get a copy of the raw CSV data that you can use to build the dashboard while you follow along with the video.
You can also view a copy of the completed dashboard to refer to as you follow along and enter formulas etc.
The three main dashboards (not the introductory dashboard), have a “Dashboard Revamp” lesson that will show you how to make the dashboard look much better, to match the pictures shown in each dashboard lesson. (Functionality the most important thing to get in place first when building dashboards, and then visual appeal can always be improved later.)

Basic Sales Dashboard (+ Dashboard creation concepts / methods)
Start building the basic sales dashboard
This dashboard is the easiest to complete. It will get you up to speed on a lot of important concepts and allow you to create a dashboard from start to finish in a relatively short amount of time. Starting with this dashboard will make it easier for you to create the following dashboards.
Customer Survey Dashboard (Google Forms Dashboard)
Start building the customer survey dashboard
This dashboard focuses more on staging & analyzing data, and keeps the data visualizations simple. You will learn many ways to use the COUNTIF function, which is extremely important for being able to analyze data / make needed calculations for your dashboards.
Online Sales Dashboard (Interactive dashboard)
Start building the interactive sales dashboard
This dashboard will teach you how to make your dashboards interactive, and contains many more important formulas / concepts than the basic introductory sales dashboard. This dashboard contains an optional lesson that will introduce you to using multiple reports to feed a single dashboard.
Student Attendance Dashboard / Tracker (Simple + Advanced)
Start building the attendance dashboard
This dashboard is the largest dashboard, and contains the most dashboard methods / concepts. This dashboard has a simple version, as well as an an advanced version that you can build / add to your existing dashboard, after finishing the simple version. This tutorial will also show you how to make trackers that show individual daily student attendance, and will also show you how to make individual tabs that show data specific to individual employees / teachers.
This dashboard will show you advanced concepts for using multiple reports to feed a single dashboard. In the simple version you will use two reports, and in the advanced version you will add in a third report.
Additional Dashboard Resources:
Creating graphs and charts (Example data included for each chart type)

