
Are you looking for an Excel template that has graph paper that you can use and print? With the Microsoft Excel graph paper template on this page, you will find every type of graph paper that you might want, all in one convenient place.
Now you won’t have to go searching every time you want to print off graph paper. You can either print the graph paper from the template, or you can use it directly in the spreadsheet by filling in the squares.
In the template linked below, there are several different sizes and border shades of graph paper to choose from on the spreadsheet tabs.
Further below you will find links to PDF versions of each template, for each size and each shade.
Then after showing you the premade templates, I will show you how to make your own Excel graph paper, how to print it, and how to make it into a PDF.
This page contains the graph paper template for Microsoft Excel (plus instructions on how to make your own). The templates on this pages were created specifically to be used in Microsoft Excel. But click here if you want the Google Sheets version of the graph paper template.
The Excel graph paper template
Combined Excel graph paper template (.xlsx)
Each tab is properly formatted to fit the page in portrait layout, so that you can easily print it. In the print preview screen, if there are any rows that do not fit on a single page, simply choose “Fit sheet on one page“.
Choose the graph paper square size
There are four different sizes that you can choose from, whether you want smaller squares or bigger squares.
Small
Medium
Large
Extra Large
Choose the shade of graph paper that you want (border darkness)
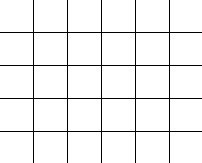
You can also pick from three different shades of squares, depending on whether you want the squares to be very light, or very dark.
Light

Normal
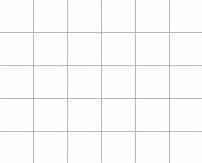
Dark
PDF Graph paper templates
If you prefer PDF graph paper… A PDF version for each graph paper type is linked below. The Excel template is linked near the top of the page.
Normal line graph paper | small squares PDF
Normal line graph paper | medium squares PDF
Normal line graph paper | large squares PDF
Normal line graph paper | extra large squares PDF
Light line graph paper | small squares PDF
Light line graph paper | medium squares PDF
Light line graph paper | large squares PDF
Light line graph paper | extra large squares PDF
Dark line graph paper | small squares PDF
Dark line graph paper | medium squares PDF
Dark line graph paper | large squares PDF
Dark line graph paper | extra large squares PDF
To use the Excel template and print graph paper, follow these instructions:
- Download the template at the top of the page (.xlsx)
- Open the template in Excel
- Click on the tab that has the graph paper that you want to print
- Click “File, and then click “Print”, or simply press CTRL+P on your keyboard
- Make sure that “Portrait” layout is selected
- Select “Fit sheet on one page”
To download the Excel graph paper as a PDF, click “File”, then click “Export”, then click “Download as PDF”.
But remember that a PDF for each different type of graph paper is linked above.
Whether you are a teacher who uses graph paper all of the time, or an artist that likes to make geometrical drawings, this graph paper will give you exactly what you need.
How to make a graph paper template in Excel
Now let’s go over how to make your own custom graph paper template. Remember that this has already been done for you in the template linked at the top of this page, which contains multiple sizes and shades of squares. But if you prefer to make your own Excel graph paper, here is how.
Making a grid of squares / graph paper (custom square size)
First we need to make a grid of squares for the graph paper so that the columns are the same width as the row height.
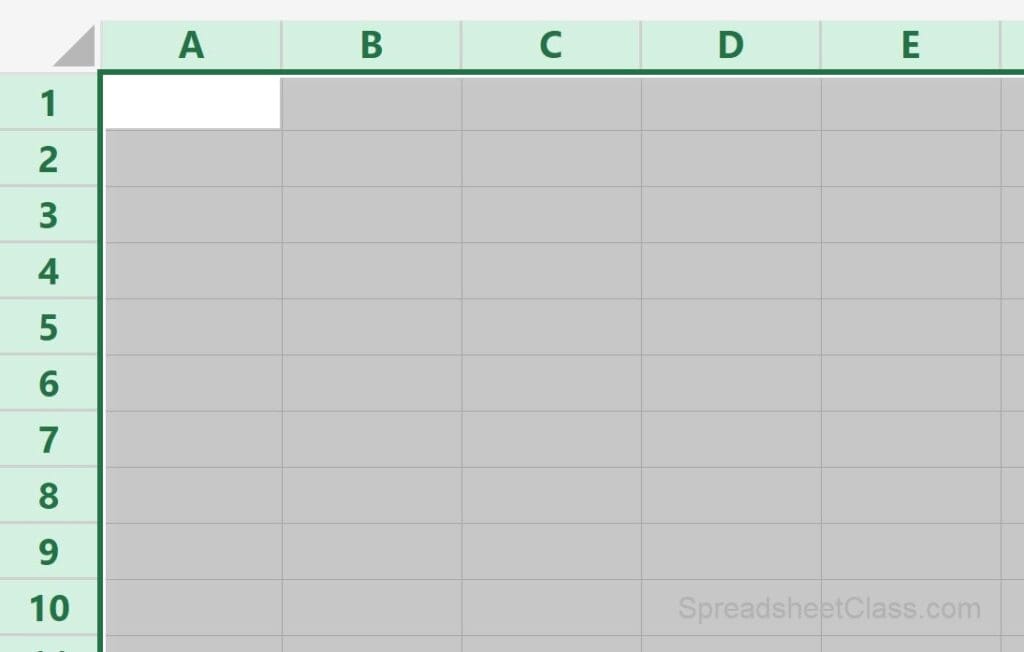
Select all cells by clicking the small grey triangle in the upper-left corner of the sheet (shown below), or by pressing Ctrl + A on the keyboard.
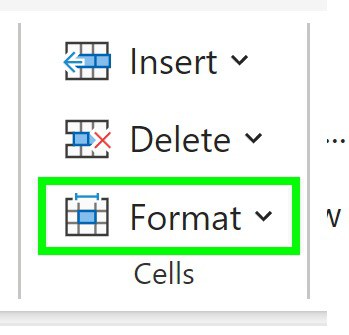
On the top toolbar, in the “Cells” section / menu, click “Format”
Click “Column width”
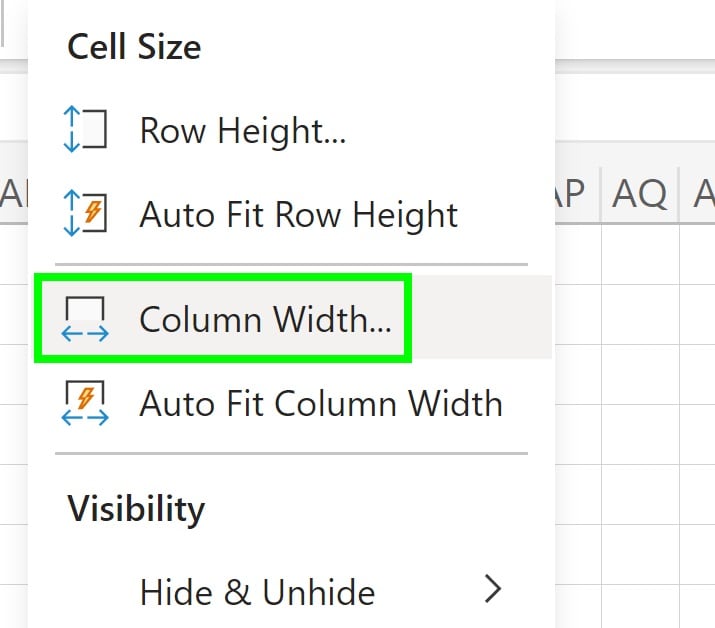
Set the column width to “3”.
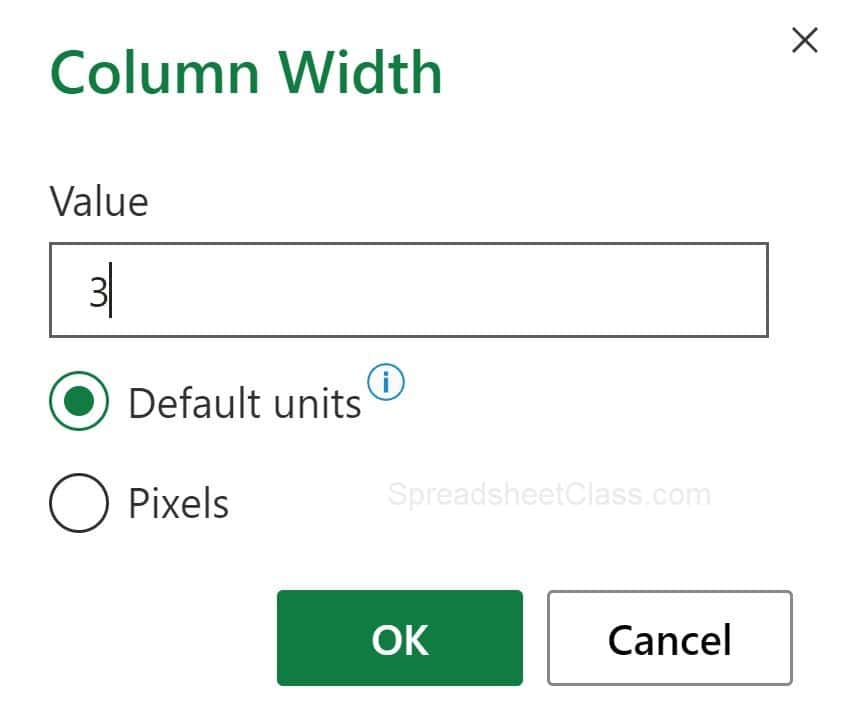
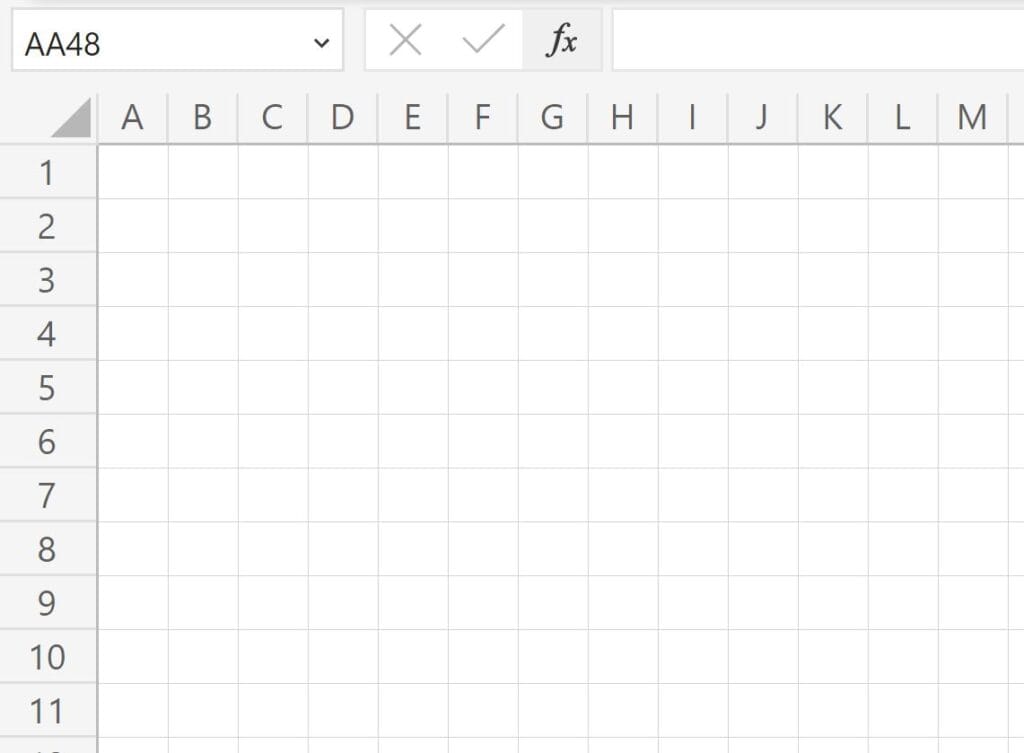
This will make the columns the same width as the row height, which will make the cells into squares, as you can see in the image below. You can make the squares any size that you want by following the steps above and adjusting the column width + row height as needed.
Page setup / preparing to print the graph paper
Now let’s use the “Page Setup” menu to prepare the graph paper for printing. Further below I will show you how applying borders will allow you to customize and make printing the graph paper easier, but for now let’s go over the method without borders.
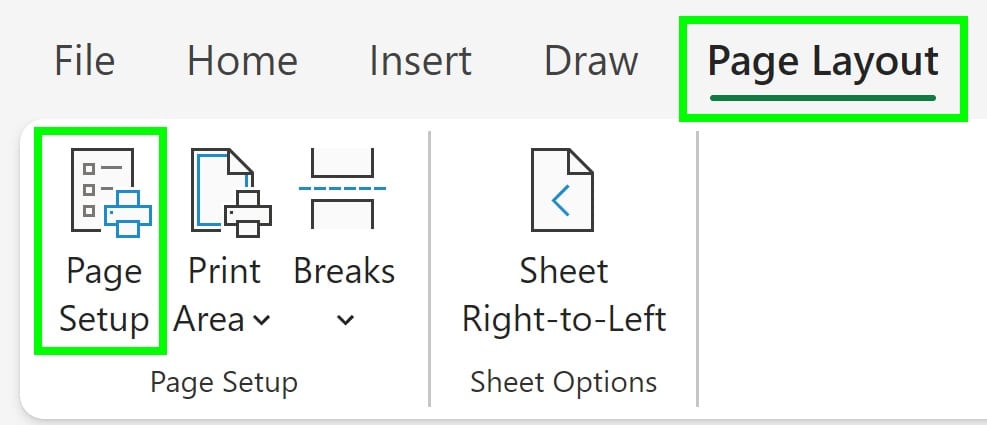
On the top toolbar, click “Page Layout”
Click “Page Setup”
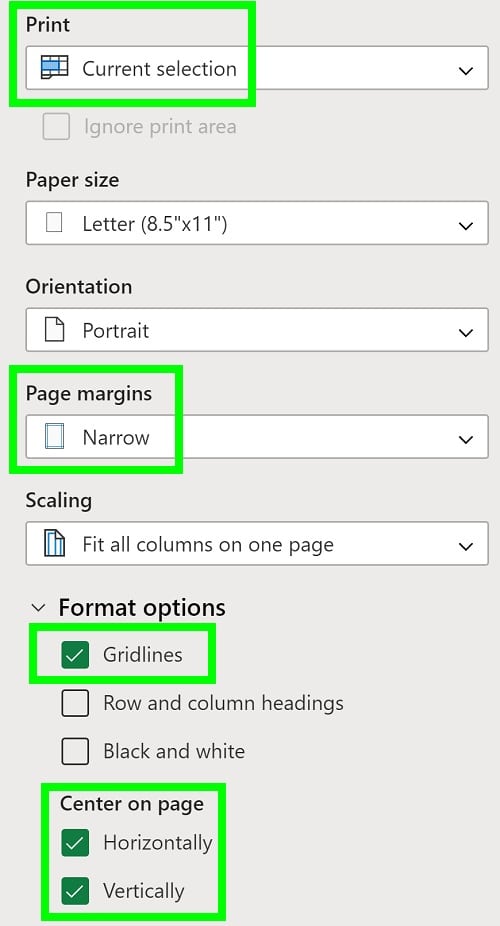
Select “Current Selection” under the “Print” dropdown. This will print the cells that you have selected.
(When you are ready to print, select the cells that you want to print. The range A1:Z47 is great for printing squares that are the size we went over above)
Set the margins to “Narrow”. If you want you can set custom margins, such as setting the top / bottom / left / right margins to 0.
Under “Format options”, check the “Gridlines” checkbox. This will make it so that the gridlines will actually print.
Applying borders to customize and make printing easier
You can apply borders to your graph paper squares / cells to make the squares any color / shade that you want… whether you want light squares, dark squares, or a custom color.
Adding borders also makes it easy to print the graph paper.
#1 The borders will print without you having to select “Gridlines” in the page setup menu.
#2 The borders will print without having to select “Current selection” in the print / page setup menu. For example, if you apply borders to the range A1:Z47, when you print the sheet the section of the sheet that contains borders will automatically select the correct cells to print, in the print preview.
To add borders to your graph paper squares, first select the cells that you want to add borders to, such as A1:Z47.
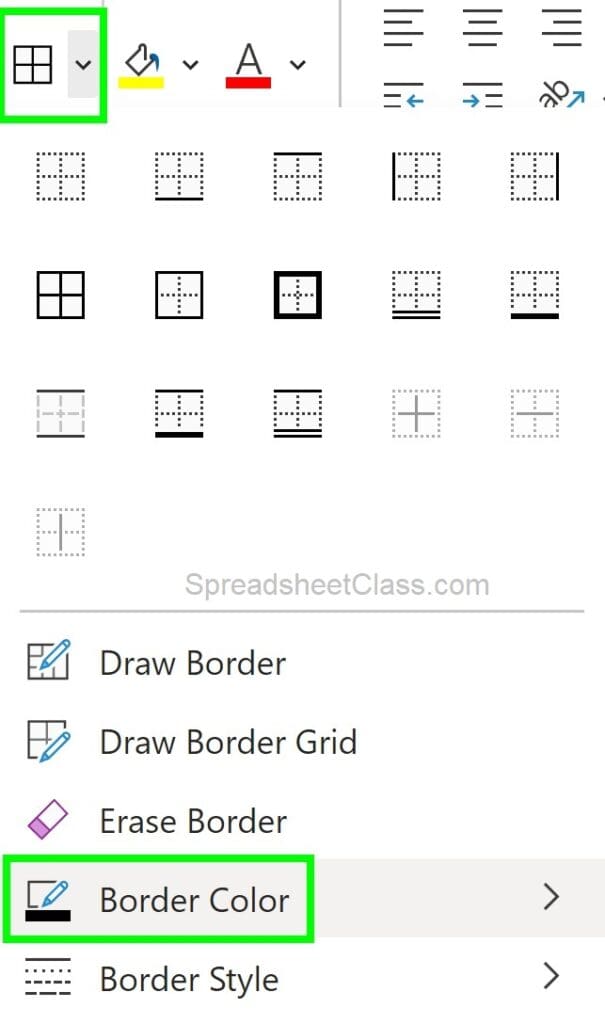
Expand the “Borders” menu on the top toolbar
Select any color from the “Border Color” menu (or leave it black / default)
Select the “All borders” option.
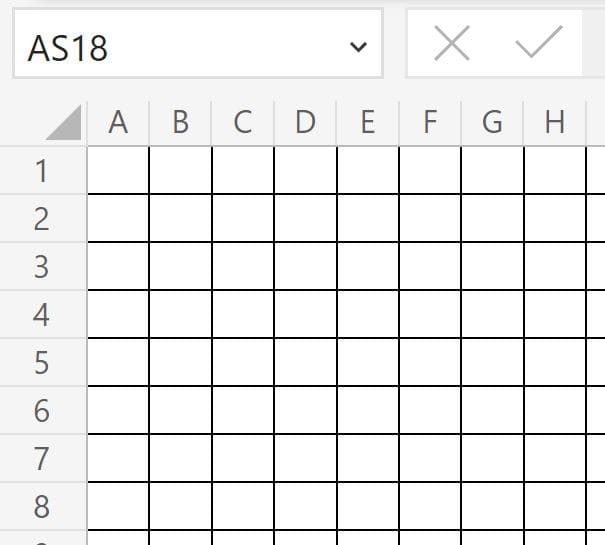
After following the steps above, your graph paper grid will now have borders, as shown below. Now you can print your graph paper much easier, and you now know how to customize the color / shade of your grid.
You also know how to customize the size of your grid squares, and you know every step that you need to make your own graph paper template in Excel!
Scroll to the top of the page to get the premade graph paper template for Excel.

